The Surprisingly Simple Strategy That Works When Everything Else Doesn't
- Marius
- Apr 12
- 8 min read

A portfolio that works for thirty years can still fail you in the two years that matter most.
The danger is not just that markets fall. It is that they often fall at the worst possible time: when the economy is slowing, jobs are being cut, and your income may be shrinking along with your portfolio. If you cannot reduce your expenses fast enough, you may be forced to sell investments at exactly the wrong moment, locking in losses that time would otherwise have healed. Bonds are the traditional cushion in that scenario, but 2022 reminded investors that bonds and stocks can fall together, removing the protection right when it is needed most.
There is a surprisingly simple strategy that observes where prices have been going and adjusts using evidence, not predictions or forecasts. It has been documented across nearly two centuries of markets, and it tends to work best exactly when traditional portfolios struggle most. That strategy is called Trend Following.
Trend Following – Putting Momentum to Work
Trend following is simple sounding, but not easy to pull off. It buys on the way up, after a recent low, and sells on the way down, after a recent high. Decisions are made using price movement data, not predictions or forecasts.
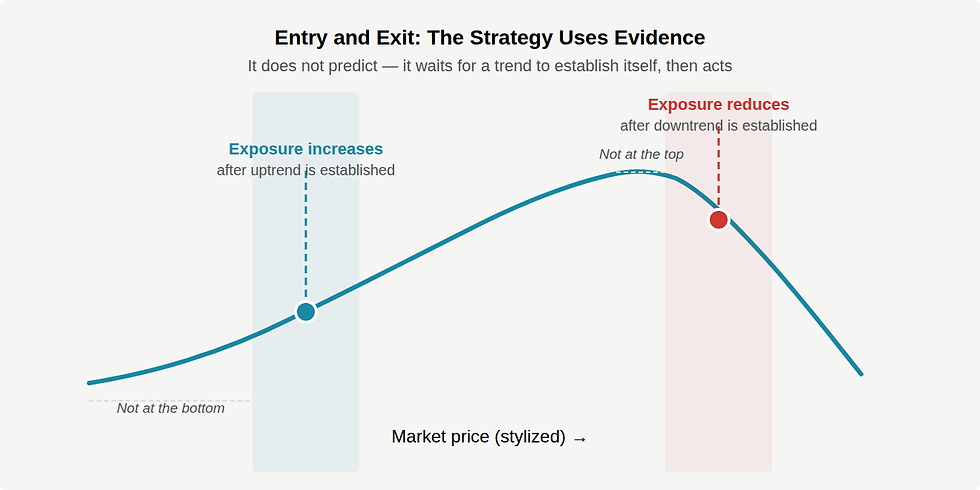
In practice, trend following looks like a "sell the dip" strategy — exactly opposite of most people's instincts. The strategy never gets in at the exact bottom or out at the exact top. That lag is not a bug, it's a feature. Waiting for a trend to establish itself before acting is exactly what keeps the strategy from reacting to every short-term fluctuation.
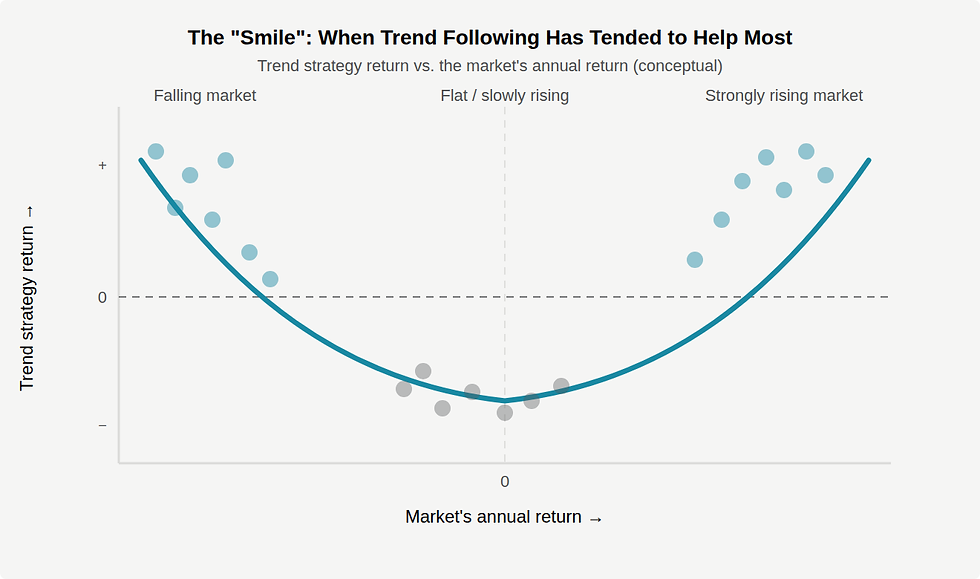
The result is a pattern of returns that researchers have described as a "smile." The strategy has historically done well during both strongly rising markets and prolonged market declines, while lagging during calm, gradually rising markets, which is most of the time.
Why Prices Trend in the First Place
Think about the last time you discovered a serious problem (in a project at work, say, or something in your home). The problem did not announce itself all at once. You got one piece of bad news. Then another. Then another. By the third or fourth update, you had a much clearer picture. Nothing about the underlying situation had actually changed between those conversations. You were just getting more of the information that was already there.
Financial markets work the same way. When something shifts in the economy (interest rates are heading higher, a company's fundamentals are deteriorating, a commodity is becoming scarce), that information does not reach all investors at the same time, or with the same force. Some act immediately. Others wait for more evidence. Many only respond after they see prices moving. The result is that prices do not always jump instantly to wherever they are ultimately going. They move in stages, and those stages can persist for months.
There is also a structural dimension. Some of the largest participants in financial markets, including central banks, corporate hedgers, and pension funds following mandated rebalancing rules, act for reasons unrelated to return-seeking. A central bank intervening to slow a currency move creates a trend in that currency. A corporation systematically hedging future commodity purchases creates sustained directional price pressure. These flows persist regardless of whether the resulting price movement looks expensive or cheap to other investors, and they do not disappear quickly.
Researchers examined 67 markets over 137 years across stocks, bonds, currencies, and commodities for a 2017 paper called A Century of Evidence on Trend-Following Investing. They found consistent evidence of trending behavior in all of them. A separate study extended the record to nearly two centuries. The persistence of these patterns across time, geography, and asset class suggests they reflect something durable about how markets work, not a temporary anomaly that will be competed away. This persistent, directional price movement has a name: momentum.
What It's Designed to Address
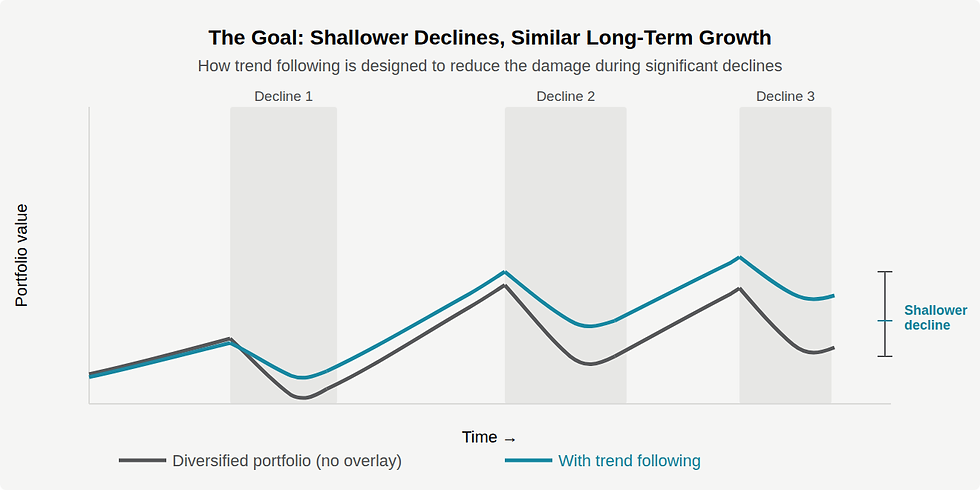
Severe, prolonged market declines. A standard diversified portfolio feels the full force of a significant market decline. Stocks fall. If bonds are not providing an offset (as 2022 showed, they may not during periods of rising inflation and interest rates), there is nowhere to hide. Large declines are particularly damaging because the math of recovery is unforgiving: a 50% loss requires a 100% gain just to break even, and that can take years.
Trend following is designed to reduce market exposure as conditions deteriorate and restore it as they improve. Research examining every major market decline from 1985 to 2018 found that trend-following strategies held up better, on average, across those periods than holding bonds, gold, or other common defensive positions. Buying protective options on the market is reliable but researchers found it prohibitively expensive as an ongoing strategy, with return drag during normal markets that compounds significantly over time. Trend following does not carry that kind of ongoing cost.
The same research identifies a second dynamic strategy that also held up well during market downturns: favoring stocks of highly profitable, financially sound companies over lower-quality ones. This approach benefits from what researchers call a flight to quality when markets fall sharply, as investors rotate away from weaker businesses toward stronger ones. Importantly, quality and profitability strategies and trend following have historically been uncorrelated, meaning they have tended to help at different times and in different ways. Combining them is more effective than using either alone. This is one reason we use both. We will cover quality and profitability investing in a future post.
A Century of Evidence on Trend-Following Investing shows most significant market declines develop gradually. Among the ten largest peak-to-trough drawdowns in a traditional 60/40 portfolio over 137 years, the average decline lasted approximately 15 months. That is what creates the opportunity for an adaptive strategy to act. The one environment where it does not work well is a sudden crash that resolves in a matter of days; the strategy needs time to recognize a sustained move, and we return to that limitation below.
Inflation. Stocks and bonds have historically both struggled during periods of high and rising inflation, removing the usual benefit of holding both. Research covering nearly a century of inflationary episodes across the United States, United Kingdom, and Japan found that trend-following strategies were among The Best Strategies for Inflationary Times. Most inflation shocks do not arrive overnight. They build over months, exactly the kind of sustained, directional price movement an adaptive strategy is built to track.
We use trend following to manage risk, specifically to reduce the depth of declines when markets fall significantly.
What the Strategy Does Not Catch
Understanding the failure modes of a strategy is as important as understanding when it works. Trend following has three characteristic situations where it struggles, and anyone using it should expect all three.
Whipsaw. This is the most common and most frustrating experience. The market appears to establish a trend. The strategy increases exposure. The trend reverses sharply. The strategy exits at a small loss, and then the original trend resumes without it. This can happen multiple times in a row, producing a string of small losses even when the long-run track record is positive. No strategy that uses evidence before acting can fully avoid this. It is the cost of being adaptive rather than predictive.
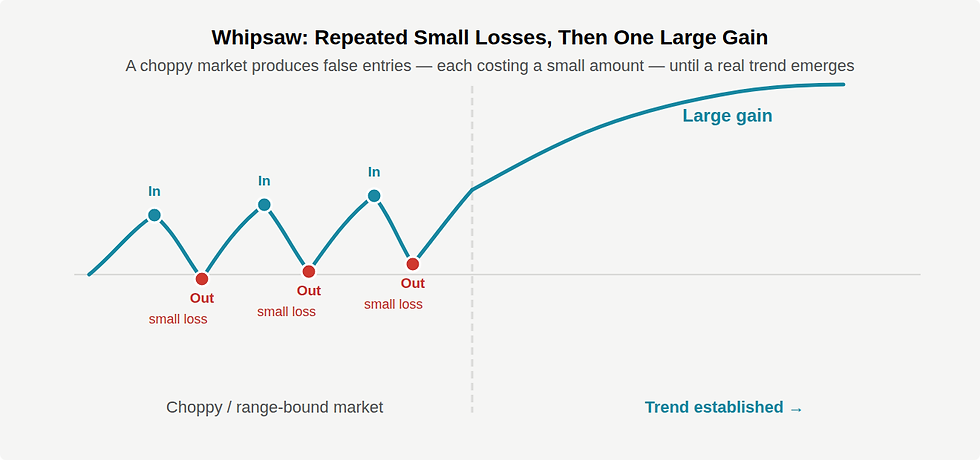
Range-bound markets. When prices move up and down without establishing a direction, the strategy repeatedly enters and exits at small losses. There is no trend to capture. This is the most common condition during quiet periods, and it is the primary reason the strategy tends to lag a simple buy-and-hold approach when markets are calm and rising gradually.
Rapid crashes. Sharp declines that unfold over a few days rather than developing over weeks or months happen too quickly for the strategy to reposition. Research on historical crisis periods specifically identifies the 1987 Black Monday crash as an example: the decline was too sudden for a trend-following approach to act. The strategy is built for sustained moves. Shock events that resolve quickly are outside its design parameters.
The Shape of Returns and Why It Tests Your Patience
Even when the strategy is working as intended, the pattern of returns is uncomfortable to live through. Most periods produce small gains or small losses. The strategy's overall performance tends to arrive in a relatively small number of large moves: the major trends it successfully captures.
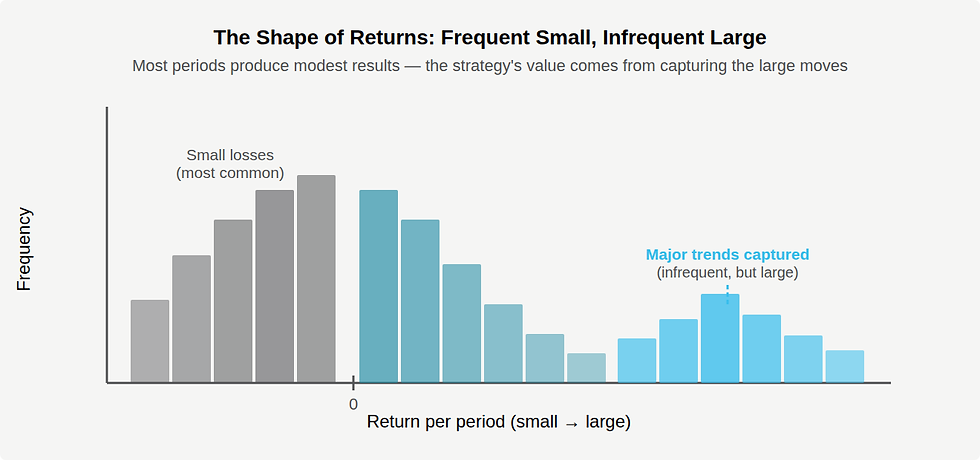
This asymmetric pattern is essential to understand before committing to the strategy. During a long, calmly rising market, you may experience months or even years where the strategy contributes little and appears to be a drag on performance. That experience is not a sign that something is broken. The strategy is functioning as designed, staying engaged, accepting small costs, and positioned for the moves that matter.
The Hardest Part: Staying With It
One of the most consistent findings in long-term investing research is that the biggest threat to a plan is not market risk — it is the decision or need to change course under pressure. Trend following is particularly exposed to this because its underperformance tends to be most visible during the long, quiet periods of rising markets that feel the best. When markets are steadily climbing and the strategy is lagging, the emotional case for abandoning it is strongest.
There is an irony here worth naming. Trend following actually helps with the hardest behavioral challenge in investing: the panic that comes from watching a portfolio fall sharply, sometimes during the same period when income is also threatened. By reducing the depth of those declines, it reduces the pressure to make a costly decision under the worst possible conditions. What it trades away is some of the easy upside during periods of calm, rising markets. In other words, it moves the hard part of investing from living through terrible markets to missing some gains in moderately good ones. That is usually a worthwhile trade, but only if you understand it going in.
The academic foundation for this strategy, including the time series momentum study by Moskowitz, Ooi, and Pedersen, documents that the strategy's payoff depends on staying invested through the quieter periods. Abandoning it after a stretch of underperformance typically means missing the periods where it earns the most. We discuss this directly with every client who holds it, before they hold it.
Who This Strategy Is For
We use trend following for risk management, not to maximize returns, but to reduce the damage when markets fall hard and stay down. It tends to be most appropriate in the following situations.
Near the transition from saving to spending. Roughly within ten years on either side of retirement, a large market decline can permanently alter the plan in ways that are difficult to recover from. Reducing the depth of that potential decline is often worth more at that stage than capturing additional gains during a period of strong markets.
When income and portfolio could fall together. Severe market declines tend to coincide with economic downturns, the same environment where jobs are cut, business revenues fall, and income becomes uncertain. If your portfolio declined sharply at the same time your income dropped, and you could not immediately reduce expenses, you might be forced to sell significant investments at exactly the wrong moment. That forced selling locks in losses that would otherwise have recovered over time. Reducing the depth of the potential decline reduces the pressure to sell.
When behavioral risk is real. If a severe market decline would prompt a re-evaluation of risk tolerance and a shift to a more conservative approach at exactly the wrong time, building some protection in ahead of that scenario may prevent a more costly decision later. Being honest about this is not a weakness. It is practical planning.
When a specific obligation is on the line. A business transition, a property purchase, a liquidity event. These are situations where a major market decline at the wrong moment would have real consequences beyond a lower account balance.
If none of those apply, a straightforward diversified portfolio may be the better choice. The strategy has a real cost during quiet markets, and that cost is not worth paying unless the protection it offers is genuinely relevant to your situation.


Comments